How to use iNaturalist for the upcoming Penang Bioblitz 2017!
We prepared a flyer here that explains the basics of using iNaturalist. If you're having trouble feel free to email me at sloarie at calacademy dot org.

We prepared a flyer here that explains the basics of using iNaturalist. If you're having trouble feel free to email me at sloarie at calacademy dot org.


We hit 6 million observations today! It's been a very active and awesome summer since we hit 5 million observations just 80 days ago. This will be a hard stretch to beat as a lot has happened. In fact, we launched image recognition in the iNat iOS app the same week this most recent 1 million observation stretch began!
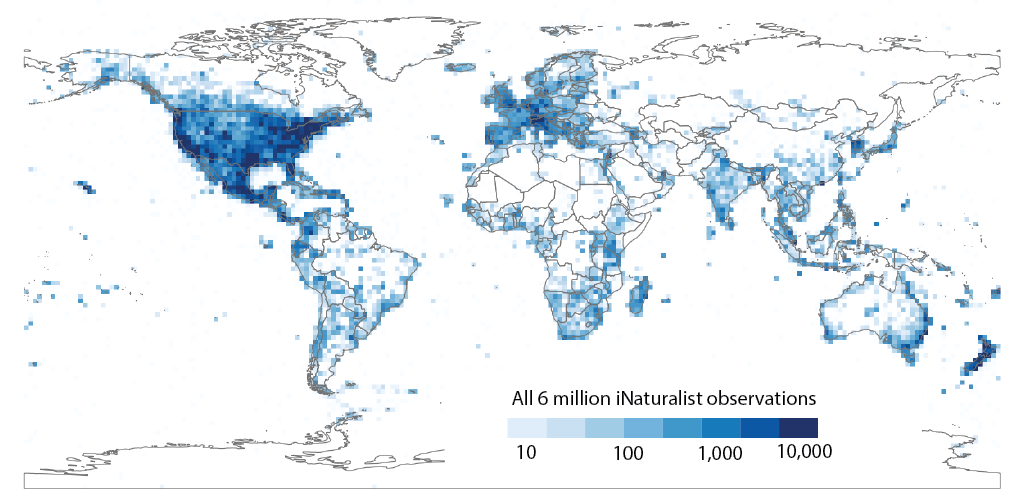
As we head into the northern hemisphere fall and things mellow out a bit, we thought we'd take a moment to consider this most recent million observations. This map shows all 6 million observations binned into 200 x 200 km pixels. iNaturalist still has the largest number of observations in a few strongholds like California, New England, Texas, Mexico, Italy, and New Zealand.
But where have these most recent million observations had the biggest relative impact? The map below shows the percent increase in observations since the 80-day stretch that produced this most recent million observations began. 100% means that the total number of iNaturalist observations in that pixel doubled in the past 80 days alone. We removed pixels with fewer than 250 observations.
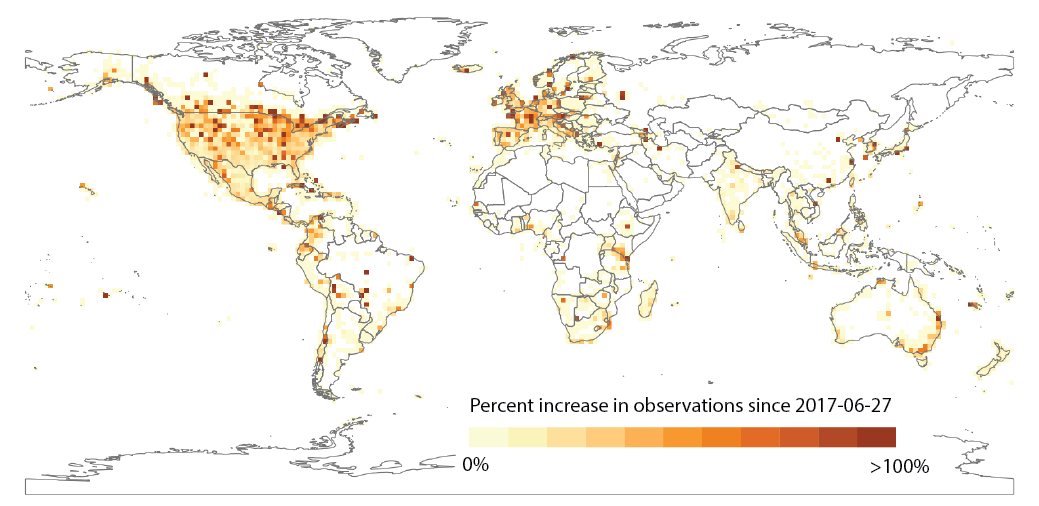
This map is very different than the overall map. iNaturalist strongholds like California and Texas don't show up as very hot because the contribution in the last 80 days isn't that large relative to the number of observations already posted from those places. But certain areas really stand out. For example, how about that bright red pixel in the middle of Brazil? Before the last 80 days, there were 182 observations in that area on the Mato Grosso / Pará boundary in Brazil. But over the last 80 days 564 more observations were posted. This ~300% (564 / 182 * 100% = 309.89%) increase was mostly driven by hundreds of observations from @birdernaturalist and @markuslilje nicely filling out this part of the map.
Theres also larger patterns on the map. Growth in southern Canada reflects a very successful Bioblitz to mark Canada's 150th Anniversary. Eastern Australia has been becoming more active in part thanks to collaborations with the Australian Museum and Questagame. In the United States, iNaturalist is growing rapidly in the Midwest and Rocky Mountains. Meanwhile, iNaturalist continues to get more traction in Europe. I should also mention neat areas of growth in Central/South America, Eastern/Southern Africa, and East Asia,
but we thought this map might be more fun for you to zoom in and explore yourself. You can find that map here if its not displaying below:

Here's some stuff

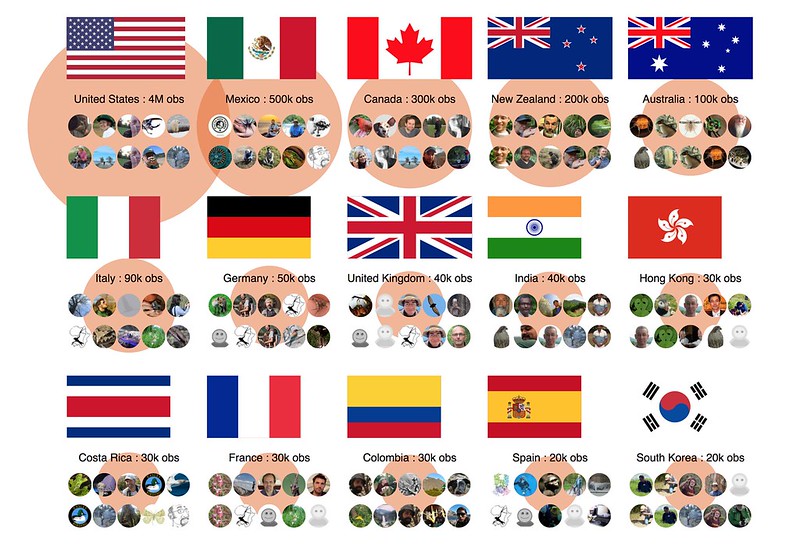
iNaturalist is most active in the US, but has observations in over 95% of all countries globally. This chart below orders the countries in descending order by the number of observations. It also displays the top 5 observers and below that the top 5 identifiers in each country which you can click on the observers and identifiers to explore further. Click here to open the chart in a new window:

iNat Odonaters (ie @jcabbott @greglasley @briang @jimjohnson @nlblock @aguilita @vicfazio3 @sambiology @scottking @ericisley @cordulegaster58obliqua),
I've been thinking alot about the value of having global coverage in our taxonomies for resolving frustrating regional taxonomic conflicts like this.
And @muir reminded me that there is a World Odonata List.
Should we be using that rather than the Checklist of North American Odonata as our primary external taxonomy source for Odonata on iNat? Since Paulson is involved in both it seems like they would be pretty compatible?
If so, I can help bring iNat's taxonomy in line with the World Odonata List.
If anyone wants to help, has extra time, and enjoys mind-numbing repetative work, there's about 100 iNat names ('Mystery iNat Synonyms') that are not on World Odonata List that I haven't been able to automatically match. If anyone wants to help me manually track down the 'Valid World Odonata Name' corresponding to each and fill in the second column of the table accordingly I'd be hugely appreciative:
https://docs.google.com/spreadsheets/d/1mVIs0Jjl538k7OEaqwfh-oy2BENWREjdOEFVsV8Ld54/edit#gid=0
Also - let me know if you're not interested in Odonata taxonomy discussions (not for everyone I know) and I'll refrain from mentioning you in the future. Likewise, let me know if I didn't mention you but you'd like to be involved in future Odonata taxonomy discussions like this.
Thanks!
Scott
Here's a figure for my proposal on how to identify 'top odonata identifiers' that I referred to in my comment below
And here's an approach that weights regional expertise more strongly alla jakob's comment below

2 weeks ago, we celebrated reaching 6,000,000 observations. This week, we have a related, but slightly different milestone to celebrate. We now have over 150,000 'observers' - ie people who have contributed at least one observation*! Here's all 150,000 observers (scaled by number of observations each). A big thank you to everyone who has contributed!

Here's another way of looking at that same data by plotting number of observers on the x-axis and number of observations on the y-axis. The curve shows the number of observers with at least that many observations.

So at the top of the curve we see @finatic in first place with 52,656 observations, @erikamitchell in second place with 36,662 observations etc.... Interestingly, the intersection of the number of observers and the number of observations is just shy of 1,000. In other words, there are just about 1,000 observers on iNaturalist who have each posted at least 1,000 observations.
Both these graphs show the disproportionate contribution that iNat power-users like finatic, erikamitchell, @jaykeller, @sambiology, @dpom etc. have had towards the total pool of 6,000,000 observations posted so far. I'm going to take this opportunity to coin a new unit of measurement which I'm calling the finatic with a current exchange rate of 52,656 observations. That means the picture below of sambiology, @psyllidhipster and @treegrow (courtesy of @muir from the recent 2017 iNat-athon in Southeast Arizona) weighs in at 42,240 (29,454+6,146+6,640) cumulative observations. Or 0.8 finatics.

Likewise, this picture of finatic, jaykeller, sambiology, @silversea_starsong, and @nathantaylor7583 (also muir's & from the iNat-athon) clocks in at 135,928 (3,769+20,372+52,656+29,454+29,677) cumulative observations. Or 2.58 finatics. If anyone can produce a picture worth more finatics than this one, I'd love to see it!

Its fun to joke around with competitions around these stats (I get great satisfaction pointing out to @kueda that he's fallen down to 20th place on the identifier leaderboard while I'm holding on in 18th place...). But it really is the hard work that each of these individual observers has put in recording and sharing observations (combined with the equally important work of the iNat identifier community) that makes all the science coming out of iNaturalist possible. This includes our recent computer vision analyses which is completely trained off of iNaturalist observations and identifications. Also our ongoing work to try to get a handle on the spatio-temporal distributions of organisms. For example, the visualization below of the spring bloom of Yellow trout lilies (Erythronium americanum) across the eastern US is completely driven by iNaturalist observations. And also all of these studies that have used data from iNaturalist shared via GBIF.
Sophisticated analyses like these computer vision and spatio-temporal examples are extremely data hungry, and the iNaturalist data stream has only just grown to the point where really exciting 'big data' analyses are possible. Our computer vision model, for example, is trained up on about 20 thousand species for which we have enough data. This may seem like a lot of species, but it really represents just a tiny fraction of the 2,000,000+ species we know are out there. So we have alot of work still to do!
Hopefully, this is just the tip of the iceberg. If we can sustain the growth rate in iNaturalist observations from the past seven years into the next three years, we'll be dealing with around 50,000,000 observations a year in 2020. While there are a thousand reasons why we shouldn't expect to be able to maintain this growth rate, its exciting to think about what this volume of observations would allow scientists studying life on Earth to do. Imagine the computer-vision and spatio-temporal analyses from the examples above working on hundreds of thousands of species from around the globe - that would be pretty cool!

And to continue this likely shamefully over optimistic projection, in order to reach that 2020 5,000,000 observation goal we'd need contributions from about 1,000,000 observers up from the current 150,000. And before reaching 1,000,000 observers starts seeming like an easy thing to pull off, remember that only represents a tiny fraction of the people iNaturalist would have to reach. For example, iNaturalist is now getting over 100,000 visitors to the website and over 7 thousand app downloads (iOS + Android) each week. But only about 500,000 of these visitors have taken the next step and created iNat accounts. And of these half a million people, only about 1/3 (150,000) have actually posted observations.

What would it take to try to get 1,000,000 people out observing nature by 2020? Is it possible for iNaturalist to scale that much and still be such a polite and knowledgable community of awesome people? I'm not sure 50,000,000 observations in 2020 is a realistic goal, but its kind of a neat number to keep in mind for where we'd be if we were somehow able to stay the coarse for another three years!
*As usual, when I count observations I mean 'verifiable' observations. We've actually had more like 190,000 people post about 7.3 million observations if you include 'casual' observations (that is observations without photos, or of captive organisms, or missing dates/locations etc.)

A few weeks ago, I wrote a blog post about how international iNaturalist is. Piggy backing on that. I thought it might be interesting to do a deep dive into each country. For example, here's a map of the US which shows the number of observations spread out regionally. In each region, the top observer is shown.
Similarly, this is how the number of observations has changed over time. Mouse over to see the top observer from each month.
Lastly, heres a breakdown of the groups of species that people are observing within the US. The top identifier for each group based on the number of identifications on these US observations is also shown.

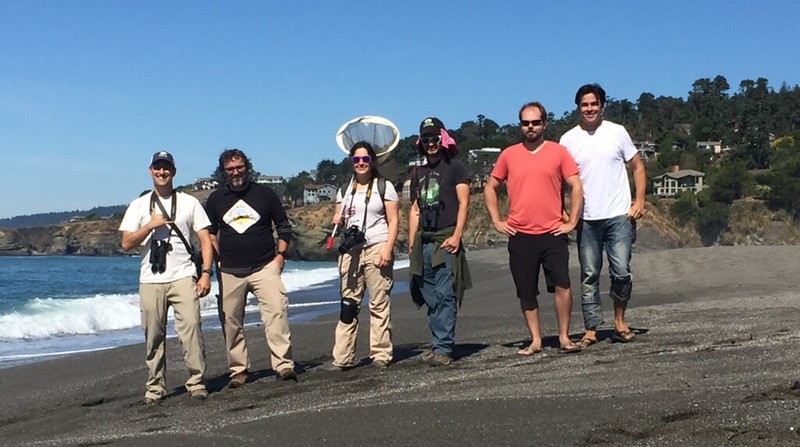
We had our 4th annual iNaturalist staff retreat this week. This time, we spent two awesome nights on the Sonoma/Mendocino county border along the coast. We spent some time exploring the Gualala River and Salt Point.
Here @tiwane, @alexshepard, @joelle, @kueda, @pleary and I are at the mouth of the Gualala River where were were surprised to stumble on a vagrant Lapland Longspur (which we sadly all mistook for a Lark Sparrow, doh).
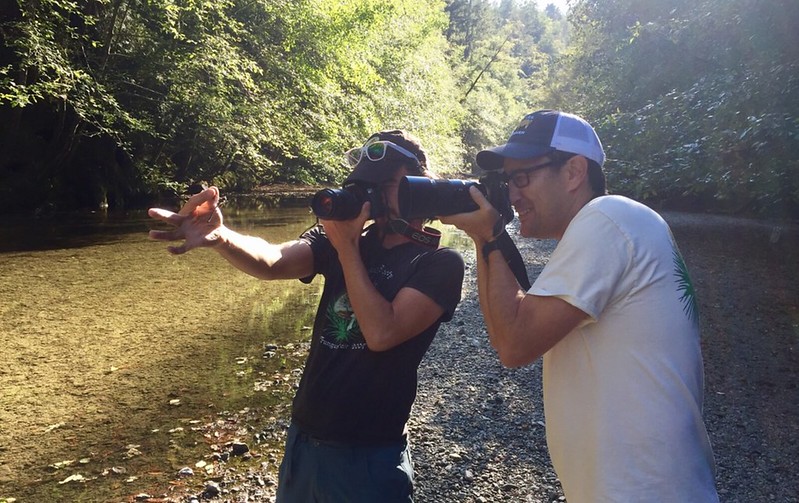
We later found a Walker's Darner along a more inland stretch of the river. Here's tiwane and kueda photographing it:
We also got a lot of more mundane work done discussing budgets and work for the next year. Here we all are hard at work - or at least some of us...:

Here's a link to see all of our observations from the retreat (I know, not super impressive, but September in California is hard...)